Logging & Tracing
เรามาเริ่มจาก Logging และ Tracing กันก่อน
-
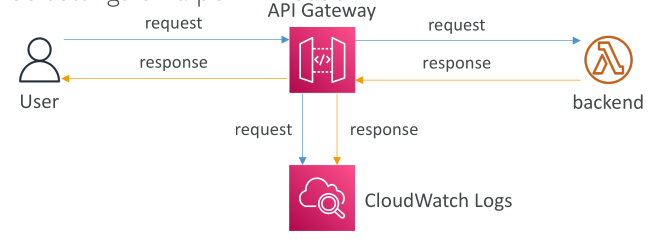
ตัวเลือกแรกคือ CloudWatch Logs เมื่อเราเปิดการเชื่อมต่อ CloudWatch Logs กับ API Gateway เราจะได้ข้อมูลเกี่ยวกับ request และ response body ที่ผ่าน API Gateway เข้ามา
- เราสามารถเปิดใช้งานได้ในระดับ Stage Level
- และเลือก Log Level ได้ เช่น
ERROR,DEBUG,INFO - โดย
DEBUGจะให้ข้อมูลละเอียดที่สุด - เราสามารถ override ค่านี้ได้เป็นราย API
👉 กระบวนการคือ:
- ผู้ใช้ (Client) เรียกใช้งาน API Gateway → API Gateway บันทึก request ไปที่ CloudWatch Logs
- Request ถูกส่งต่อไปยัง backend → Backend ส่ง response กลับมา
- Response จะถูก API Gateway บันทึกลง CloudWatch Logs ก่อนส่งกลับไปยังผู้ใช้
⚠️ ข้อควรระวัง: หากเปิด Logging อาจทำให้ ข้อมูลสำคัญ (Sensitive Information) ถูกบันทึกลงใน Logs ได้
-
AWS X-Ray ใช้สำหรับ Tracing ข้อมูลการทำงานของ request ที่ผ่าน API Gateway
- หากเปิดใช้งานทั้ง API Gateway และ Lambda จะได้ภาพรวมการไหลของ request ทั้งหมด (End-to-End Tracing)
Monitoring API Gateway ด้วย CloudWatch Metrics
API Gateway สามารถเฝ้าติดตามได้ด้วย CloudWatch Metrics ซึ่งทำงานในระดับ Stage และสามารถเปิด detailed metrics เพื่อดูเชิงลึกได้
📊 Metrics ที่สำคัญ:
- CacheHitCount → จำนวน request ที่เจอข้อมูลใน cache (บ่งบอกว่า cache มีประสิทธิภาพ)
- CacheMissCount → จำนวน request ที่ไม่เจอข้อมูลใน cache (บ่งบอกว่า cache ใช้งานไม่ค่อยดี)
- IntegrationLatency → เวลาในการส่ง request ไป backend และรอ response (เป็นเวลาที่ backend ใช้ประมวลผล)
- Latency → เวลารวมตั้งแต่ API Gateway ได้รับ request จนส่ง response กลับ (รวมการตรวจสอบ Auth, Cache, Mapping template ฯลฯ) 👉 ค่า Latency จะ มากกว่า IntegrationLatency เสมอ
⚠️ API Gateway มี Timeout สูงสุด 29 วินาที ต่อ request
- ถ้า Latency หรือ IntegrationLatency เกิน 29 วินาที → API Gateway จะตัดการเชื่อมต่อ
Metrics ของ Error
- 4XXError → ความผิดพลาดฝั่ง Client (Client เรียกใช้งาน API ผิด)
- 5XXError → ความผิดพลาดฝั่ง Server (Backend มีปัญหา)
API Gateway Throttling และ Limits
API Gateway รองรับการ Throttling เพื่อป้องกัน backend และควบคุมการใช้งาน
- ค่าเริ่มต้น (Soft Limit): 10,000 requests/วินาที ต่อทุก API รวมกัน (สามารถขอเพิ่มได้)
- ถ้ามี API ใดใช้งานหนักเกินไป → API อื่น ๆ อาจถูก throttled ด้วย
เมื่อเกิด throttling → Client จะได้รับ error 429 Too Many Requests
👉 ควรใช้ Exponential Backoff ในการ retry
เราสามารถปรับปรุง throttling ได้โดย:
- ตั้ง Stage Limits และ Method Limits → เพื่อป้องกันไม่ให้ Stage เดียวกิน quota ทั้งหมด
- ใช้ Usage Plans → เพื่อกำหนด throttling แบบรายลูกค้า
API Gateway Error Codes
API Gateway แบ่ง Error ออกเป็น 2 กลุ่มใหญ่:
🔹 4XX (Client Errors) → เกิดจากผู้ใช้งาน API
- 400 Bad Request → Request ไม่ถูกต้อง
- 403 Access Denied → ถูกบล็อก เช่นจาก WAF
- 429 Quota Exceeded → ถูก throttling
🔹 5XX (Server Errors) → เกิดจาก Backend
- 502 Bad Gateway → Lambda Proxy Integration ไม่ตอบกลับอย่างถูกต้อง
- 503 Service Unavailable → Backend ไม่พร้อมใช้งาน
- 504 Integration Failure → Backend ใช้เวลานานเกินไป (เกิน 29 วินาที) → Timeout
สรุป Key Takeaways
- API Gateway ทำงานร่วมกับ CloudWatch Logs เพื่อบันทึก request/response (เลือก Log Level ได้)
- AWS X-Ray ให้ Tracing เชิงลึกของ request flow ระหว่าง API Gateway และ Lambda
- Metrics สำคัญ ได้แก่:
CacheHitCount,CacheMissCount,IntegrationLatency,Latency,4XXError,5XXError - API Gateway มี Throttling Limit เริ่มต้น 10,000 req/sec และใช้
429สำหรับการแจ้งเตือนว่าเกิน limit - Error ถูกแบ่งเป็น 4XX (Client) และ 5XX (Backend) เพื่อช่วยวิเคราะห์ปัญหา